

Every Google, Meta and Shopify number, on one screen
A walk through the app: the dashboard, trends, KPI comparison, campaign breakdowns, organic insights, GA4 and connections. Every view reads the same synced data.
Short answer
Kampalo is one workspace for Google Ads, Meta Ads, Shopify, GA4 and Search Console. The dashboard, trends, KPI comparison, campaign breakdowns, organic insights and reports all read the same synced data, so the ROAS in a client report matches the dashboard and Kai. Free plan, or from $19/month with a 30-day trial.
The density you want, not the one we picked
Overview gives every KPI its own card with a sparkline. Focus puts revenue front and centre. Compact fits the whole picture above the fold. Same data, same period controls, switched in one click.
- 1Every headline KPI on its own card, with the change against the previous period
- 2Spend against revenue over time, plus the platform split
- 3Switch between Overview, Focus and Compact with the chips below the screen


Nine metrics, one glance, any window
Revenue, spend, ROAS, conversions, impressions, clicks, CTR, CPC and CPA each carry their own sparkline. Filter to Google, Meta or Shopify and the whole board re-reads for that platform.
- 1Nine sparklines: revenue, spend, ROAS, conversions, impressions, clicks, CTR, CPC and CPA
- 2Any date window, read at a glance
- 3Filter to Google, Meta or Shopify and the whole board re-reads for that platform

Settle the Google-versus-Meta argument
Put two platforms, two accounts or two campaigns beside each other and read ROAS, revenue, spend and CPA on the same bars. Currencies stay labelled rather than silently converted.
- 1Two platforms, accounts or campaigns on the same bars
- 2The best value in each row is highlighted for you
- 3Currencies stay labelled rather than silently converted

Tick two boxes to compare anything
One account selected drills into it. Two or more drops them into a comparison table — accounts or campaigns, Google or Meta, in whatever currency each one reports.
- 1Select one account to drill into it
- 2Tick two or more to drop them into a comparison table
- 3Works for accounts or campaigns, Google or Meta


Five breakdowns behind every campaign
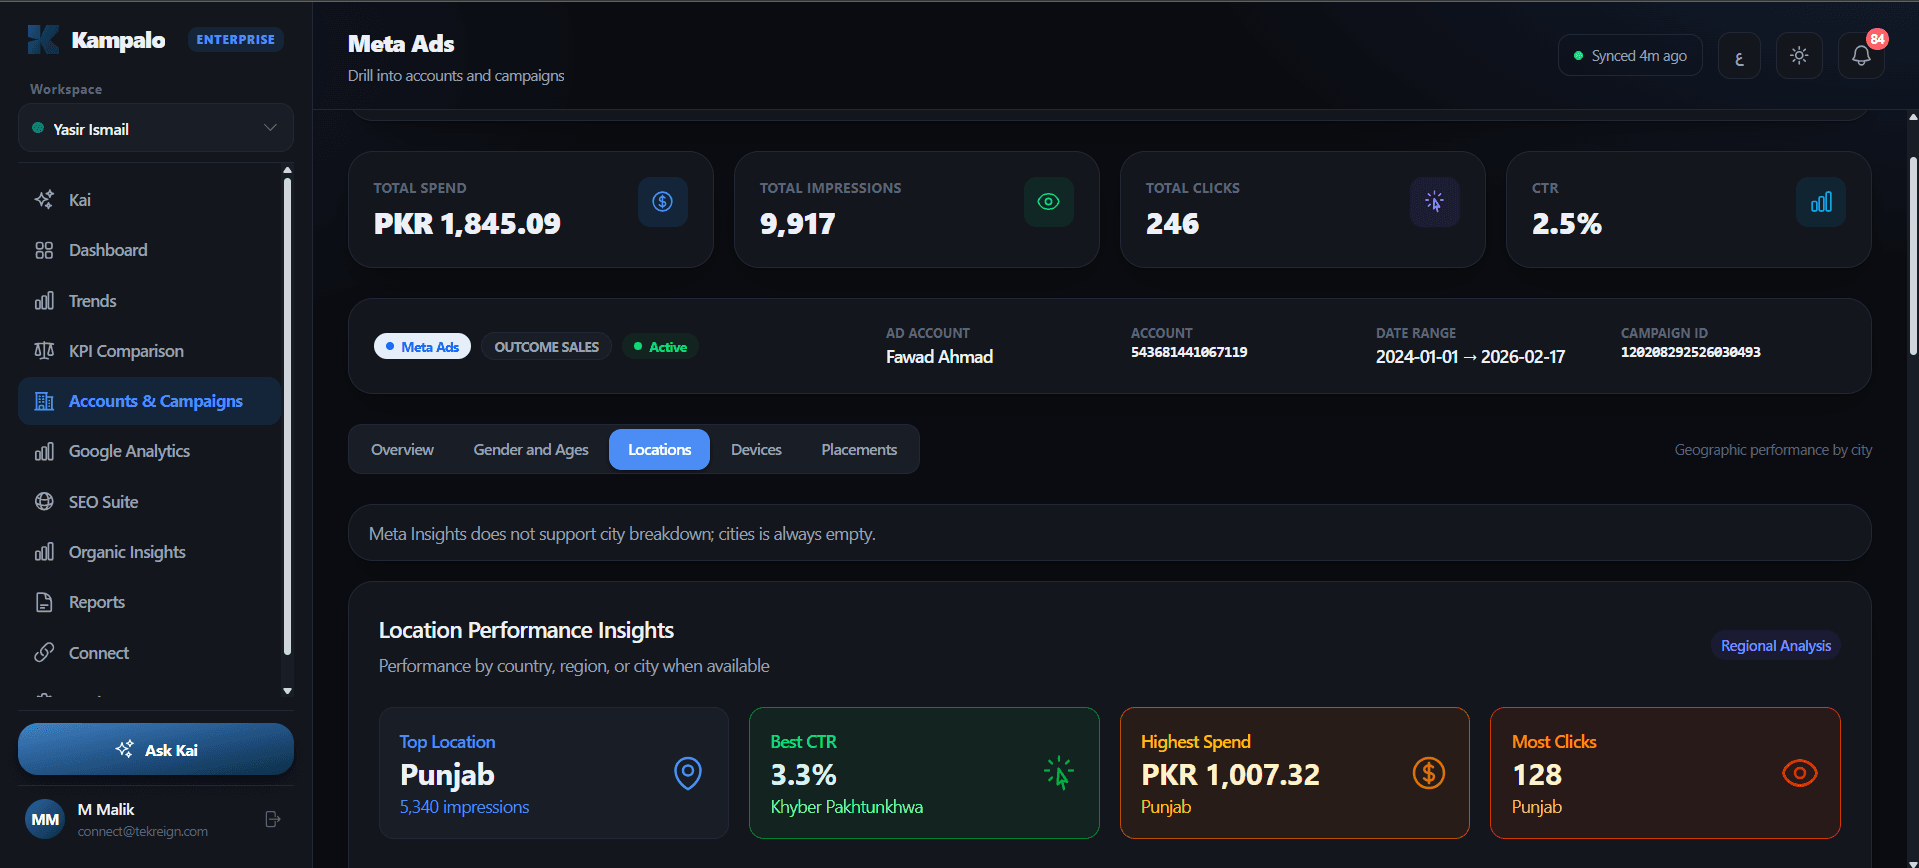
Open any campaign for spend, impressions, clicks and CTR, then read it by gender, age, location, device or placement. Each breakdown leads with the headline finding rather than a wall of rows.
- 1Spend, impressions, clicks and CTR for the campaign up top
- 2Break it down by gender and age, location, device or placement
- 3Each breakdown leads with the headline finding, not a wall of rows




The half of the picture that is not paid
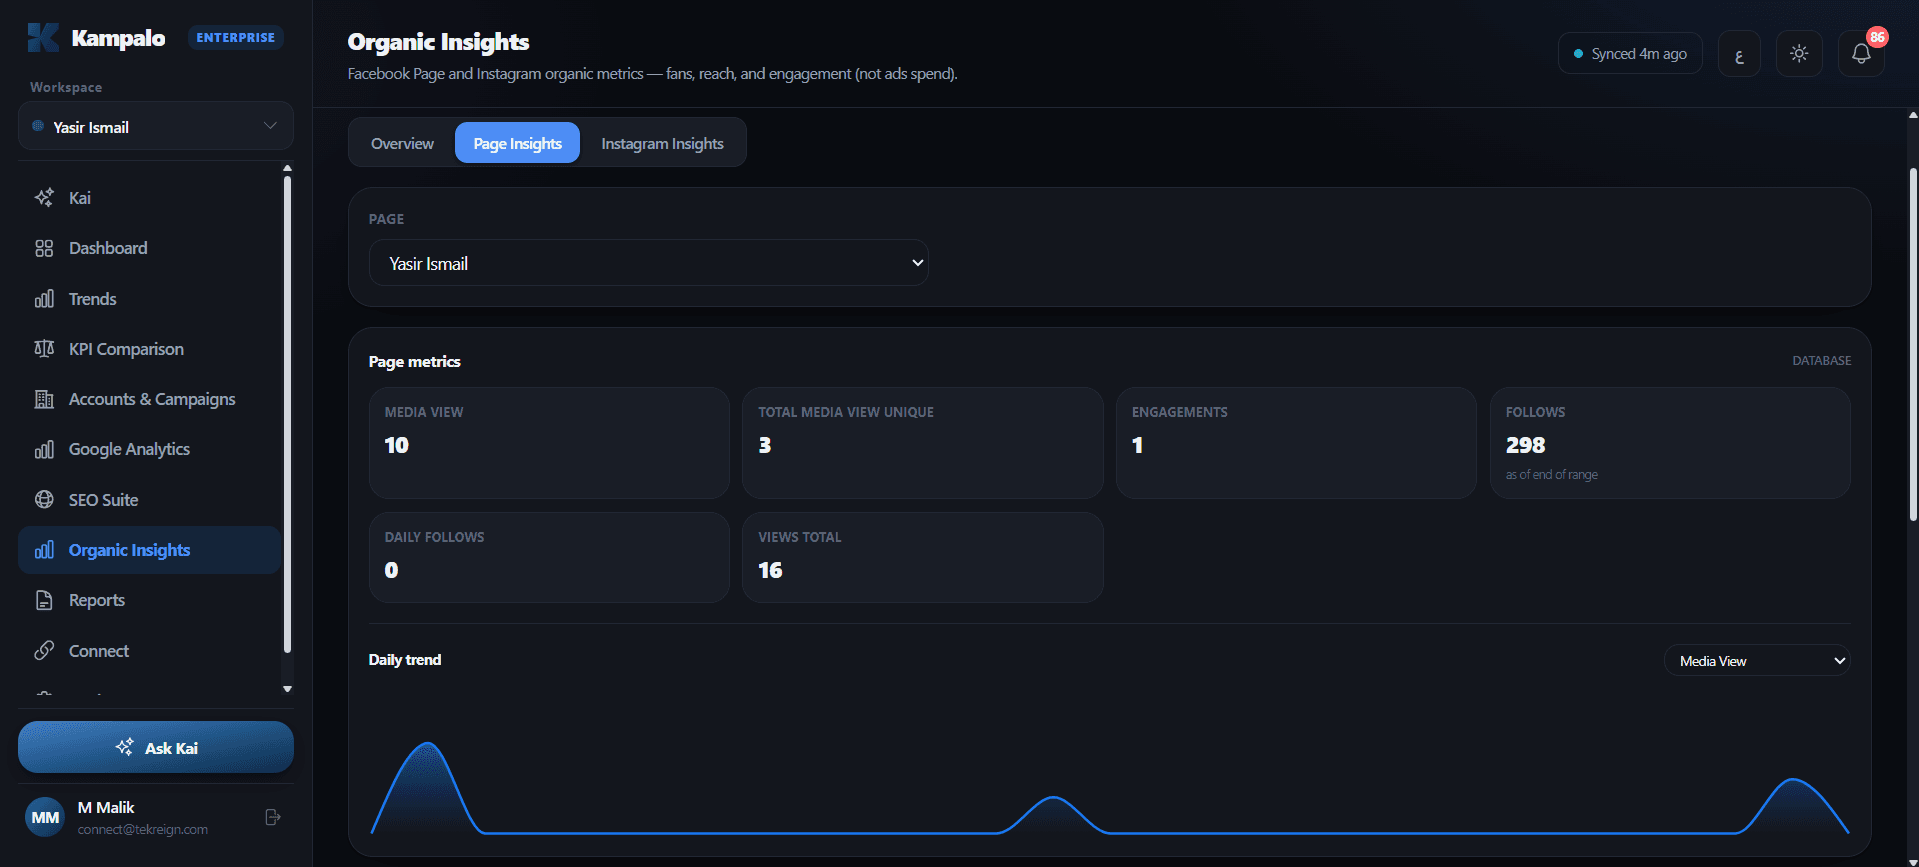
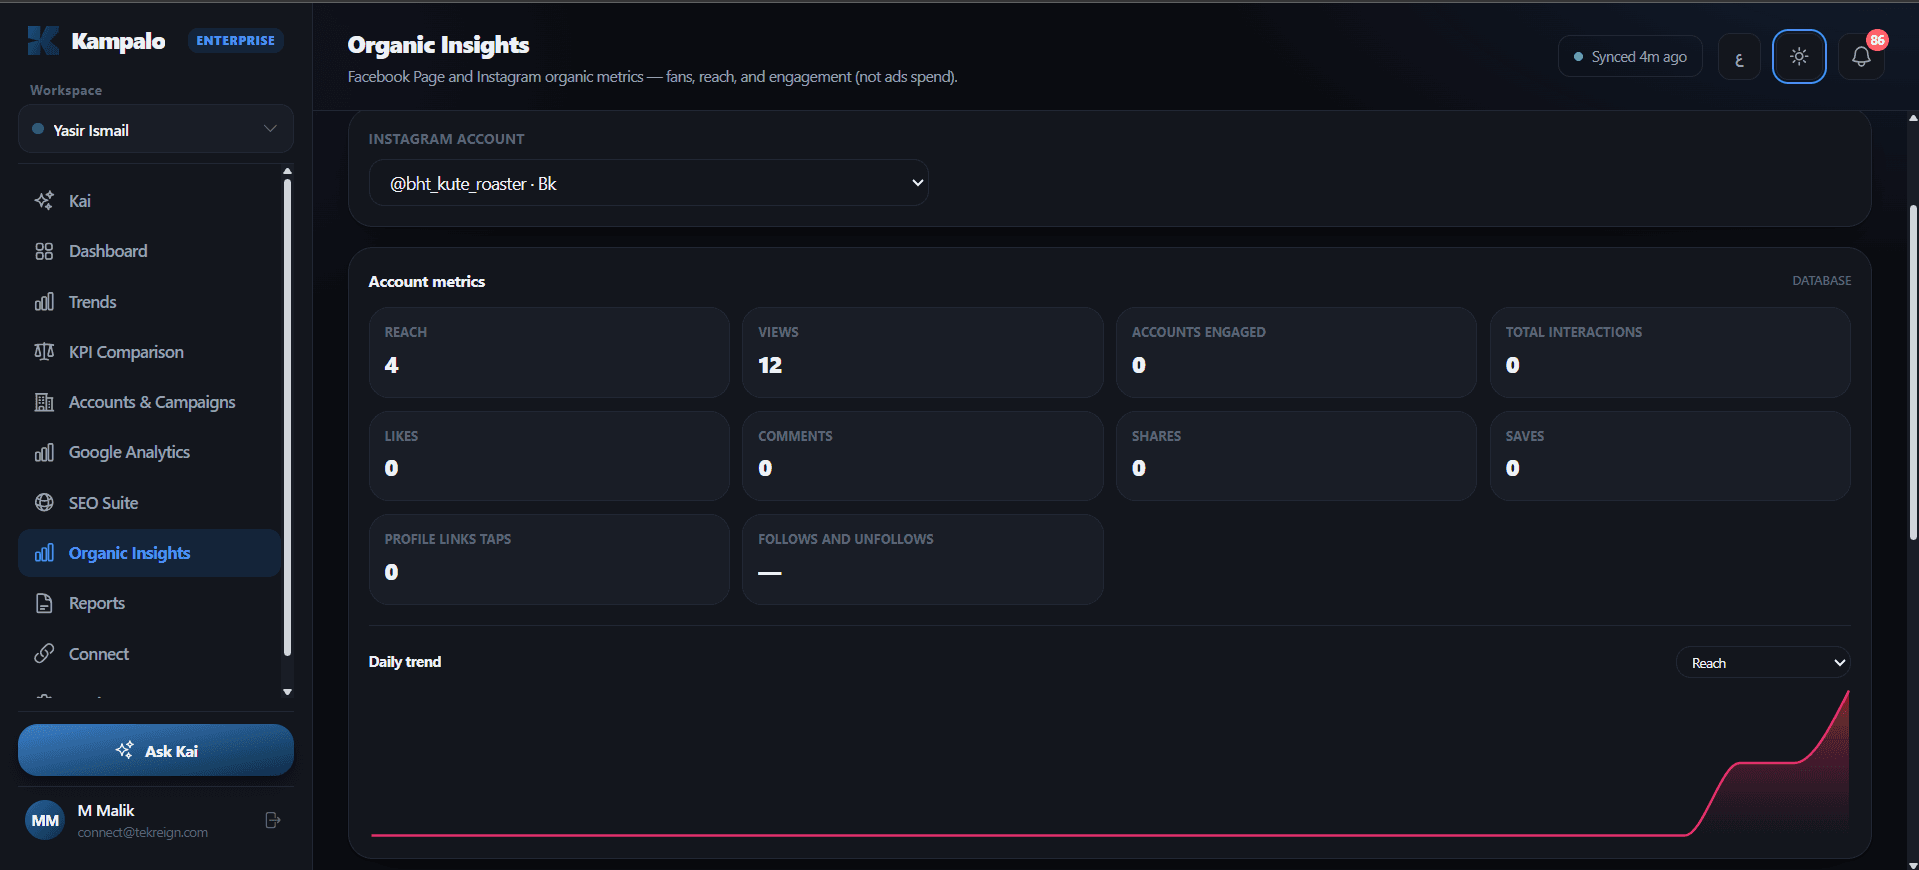
Page fans, views and post engagement from Facebook, reach, saves and profile taps from Instagram. Read on separate insight tokens, shown next to the ads numbers but never mixed into them.
- 1Facebook Page fans, views and post engagement
- 2Instagram reach, saves and profile taps
- 3Shown next to the ads numbers, never mixed into them

GA4, without the report builder
Audience, acquisition, engagement and live traffic for any property and range, with a prior-period delta on every metric and Search Console sitting next to it.
- 1Audience, acquisition, engagement and live traffic for any property
- 2A prior-period delta on every metric
- 3Search Console sits right next to it

Google, Meta, Shopify — one login each
Google Ads, Analytics and Search Console share one Google sign-in. Meta ads, Page and Instagram share one Meta sign-in. Shopify is its own shop login. TikTok Ads is next.
- 1One Google sign-in covers Google Ads, Analytics and Search Console
- 2One Meta sign-in covers Meta ads, Page and Instagram
- 3Shopify is its own shop login; TikTok Ads is next

The surfaces, one source of numbers
Every view reads from the same synced data, so the ROAS on a client report matches the ROAS in the dashboard and the one Kai quotes back to you.
Dashboard
Eight headline KPIs with period-over-period deltas, spend against revenue over time, and the platform split. Three density layouts.
Trends
Revenue, spend, ROAS, CTR and CPA as sparklines across any window, so you can see what is rising, falling or flat.
KPI comparison
Google against Meta, account against account, client against client — with the better value marked in every row.
Boards
Mix connected SEO, GA4, ads, and organic into one saved view. Free cannot create boards; Solo can create 3, Pro 10 and Agency 25, pooled across brands — not 25 per brand.
Organic insights
Facebook Page and Instagram reach, engagement and follower movement, kept separate from paid spend.
Shopify
Products, orders, customers and store analytics from one shop login, beside Google and Meta — not mixed into paid ROAS.
See your own numbers in Kampalo
Connect Google, Meta, or Shopify and the dashboard fills in on the first sync. Bring the rest when you are ready.